NYC Open Data
2026
NYC 311 Service Request Analytics
An end-to-end cloud analytics project analyzing nearly 1 million NYC 311 service requests to uncover demand patterns, service performance, geographic trends, and operational opportunities across New York City.

Overview
Turning nearly 1 million service requests into operational insight
NYC 311 generates a large volume of public service-request data across complaint categories, boroughs, and service statuses. This project analyzed 995,577 requests recorded from June 1 through August 30, 2026 to understand where service demand was concentrated, which issues were reported most frequently, and how efficiently requests were resolved.
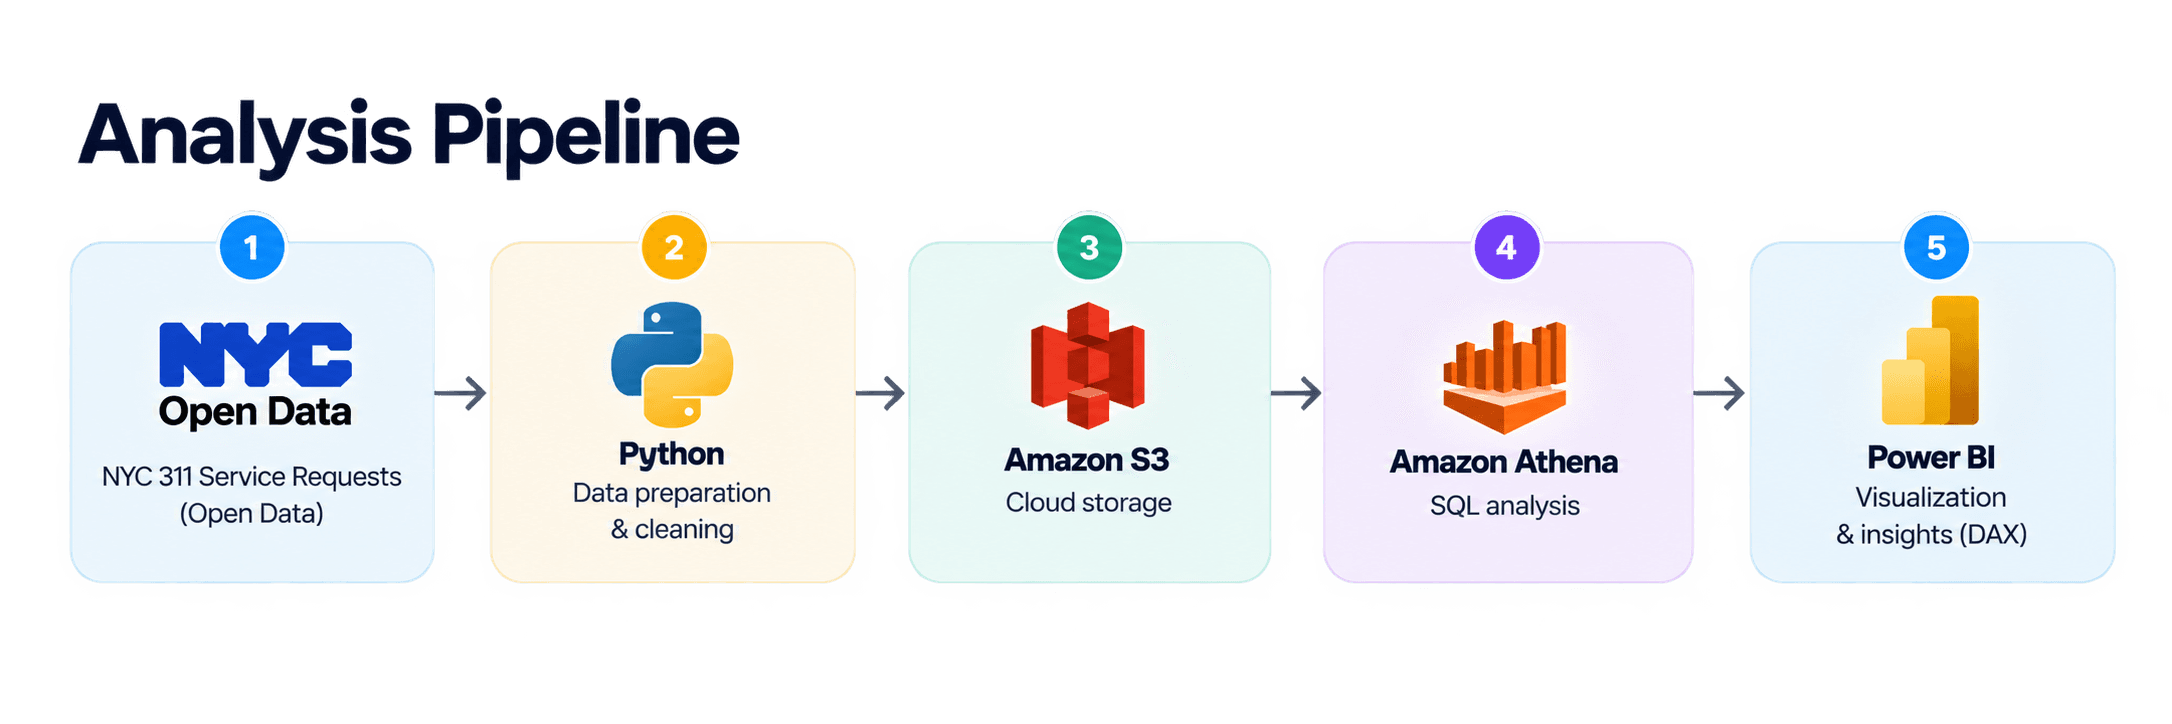
I built an end-to-end analytics workflow using Python, AWS S3, Amazon Athena, SQL, Power BI, and DAX, transforming raw public-service data into an interactive operational reporting solution.
Project Scope
995,577 — Service Requests
June–August 2026 — Analysis Period
6 — Core Analytical FieldsNYC Open Data — Data Source
Tools
Python · SQL · AWS S3 · Amazon Athena · Power BI · DAX
Business Problem
Understanding demand and service performance across NYC
NYC 311 service requests span hundreds of complaint types and multiple geographic areas, making it difficult to evaluate demand and service performance from raw records alone. City operations require a consolidated view of request volume, complaint patterns, geographic concentration, status, and time to closure to identify where demand is highest and where resolution performance may require further investigation.
Analytical Questions
Which complaint types generate the highest request volume?
Which boroughs experience the greatest service demand?
What proportion of requests are closed versus unresolved?
How long does it take to close service requests?
Which complaint categories experience the longest closure times?
How does request volume change over time?
How does closure performance vary across boroughs?
Data & Methodology
Building an end-to-end cloud analytics workflow
The analysis began with NYC 311 service-request data from NYC Open Data. Using Python, I prepared the dataset and retained six fields required for the analysis: Unique Key, Created Date, Closed Date, Complaint Type, Borough, and Status.
The prepared dataset was uploaded to Amazon S3 for cloud storage and queried through Amazon Athena. SQL analysis was then used to evaluate request volume, complaint frequency, borough demand, status distribution, closure time, and temporal patterns.
Analysis Areas
Demand Analysis
Request volume by complaint type and borough
Status Analysis
Closed and unresolved service requests
Performance Analysis
Overall, complaint-level, and borough-level closure times
Trend Analysis
Changes in service-request volume over time
Geographic Analysis
Demand and service performance across NYC boroughs
Analysis
From service-request volume to operational performance
Demand
Brooklyn recorded the highest request volume with 309,479 requests, followed by Queens with 258,382 and the Bronx with 200,363. This indicates that service demand was not evenly distributed across the five boroughs.
Complaint Patterns
Illegal Parking was the most frequently reported complaint with 155,204 requests, followed by Noise – Residential with 93,862 and Noise – Street/Sidewalk with 72,400. The results show that a relatively small number of complaint categories contributed substantial portions of overall demand.
Request Status
927,226 requests were closed, representing 93.13% of all requests during the analysis period. Remaining requests were distributed across In Progress, Open, Assigned, Pending, Started, and unspecified statuses.
Closure Performance
The Power BI model shows an overall average closure time of approximately 112.7 hours, revealing that high closure volume does not necessarily translate to uniformly fast resolution.
Closure time varied substantially by complaint type, highlighting the importance of analyzing service volume and resolution duration separately rather than assuming the highest-volume issues are also the slowest to resolve.
Geographic Performance
Among the five named boroughs, Manhattan recorded the longest average closure time at approximately 123.7 hours, while Queens recorded the shortest at approximately 91.1 hours.
Dashboard
Transforming analysis into an interactive decision-support tool
The final Power BI dashboard consolidates demand, status, geographic, trend, and closure-performance metrics into a single operational view. A detailed request-level table containing 995,577 individual records was incorporated into the semantic model so that dashboard measures respond dynamically to user selections.
Users can filter the analysis by date, borough, complaint type, and status, allowing the same dashboard to support both citywide monitoring and focused investigation of specific service patterns.
Core Dashboard Metrics
~996K Total Service Requests
927K Closed Requests
~68K Non-Closed Requests
93.1% Closure Rate
112.7 hrs Average Closure Time
Insights & Recommendations
Turning analytical findings into operational action
Key Takeaway
The analysis shows that service demand and service performance represent different operational challenges. High-volume complaint categories create workload pressure, while long-resolution categories reveal different potential process constraints. Evaluating both dimensions together provides a more useful view of operational performance than request volume alone.
Recommendations
Prioritize recurring high-volume complaints
Use complaint-volume patterns to identify categories generating sustained service demand and determine where targeted operational investigation may have the greatest impact.
Investigate long-resolution workflows
Review complaint categories with unusually high closure times separately from high-volume categories to identify potential process, routing, or service-delivery bottlenecks.
Monitor geography and performance together
Compare borough-level request demand with closure performance to distinguish areas experiencing high workload from areas experiencing slower resolution.
Limitations
The analysis covers June through August 2026 and is based on six core service-request fields. The dataset does not include staffing levels, budgets, service-level agreements, operational complexity, or internal workflow information. The findings therefore identify operational patterns and areas for further investigation rather than establishing their underlying causes.
Outcome
Built an end-to-end cloud analytics solution that transformed nearly 1 million public-service records into an interactive operational reporting tool using Python, AWS, SQL, semantic modeling, DAX, and Power BI.
VIEW DASHBOARD →
VIEW GITHUB REPOSITORY →

